

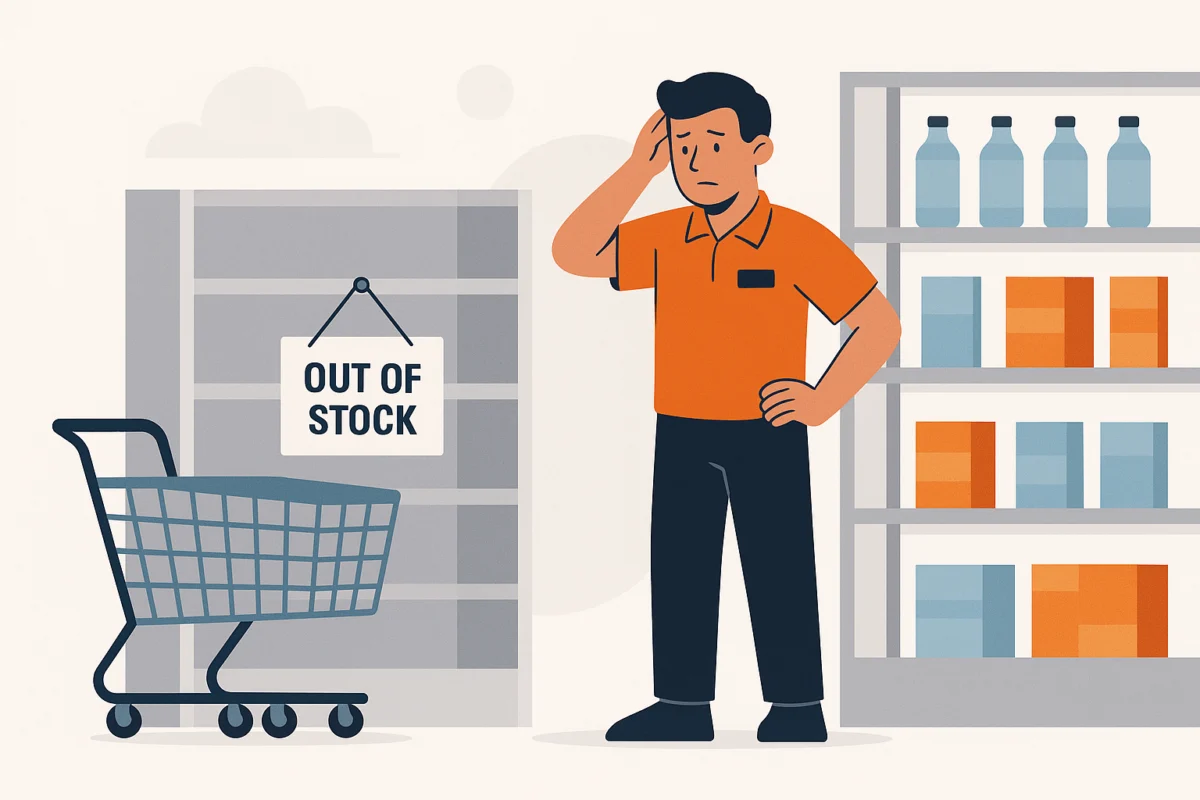
Retail management teams have long relied on a deceptively comforting metric to gauge their operational health: the clean stockout rate. Decisive, straightforward, and easy to present in a weekly review, a basic stockout percentage gives leadership a quick snapshot of inventory availability. However, retail analytics experts argue that this conventional metric hides the shortages that actually cost the most in retail sales. By treating every empty shelf as an equal event, traditional stockout counts obscure the true commercial damage happening across store networks and digital channels.
The core flaw of a standard stockout rate lies in its unit of measurement. A stockout involving a low-volume fashion accessory at 10 a.m. on a Tuesday carries an entirely different financial weight than an empty shelf for a heavily promoted bestseller on a Saturday afternoon. Yet, a basic availability KPI counts both incidents the exact same way. This is where a useful performance indicator turns into a misleading one, masking severe revenue leaks behind a seemingly healthy portfolio average.
Consumer expectations make accurate measurement more critical than ever. According to SPAR Group’s 2025 shopper survey, 74% of respondents identified product availability as their top in-store priority, while 73% pointed to out-of-stocks as the leading barrier to a positive shopping experience. Retailers do not need to be convinced that stockouts matter; the real operational question is whether their current reporting tools actually tell them which shortages demand immediate attention.
A stockout count measures frequency, not damage
Most conventional metrics simply tell management how often an item was unavailable. They fail to calculate how much actual consumer demand was sitting behind that unavailable item. This limitation becomes glaringly obvious when looking at large-scale retail disruptions. Beauty retailer KICKS, for instance, traced 39% of its lost sales during the Christmas 2024 trading period back to a single supplier, according to an account of the work published by RELEX Solutions.
The KICKS case study detailed how addressing the root cause—implementing supplier-process changes alongside a strict 24-hour delivery completion requirement—led to a reported 34% reduction in lost-sales value linked to late deliveries. That represents a truly usable diagnosis: a concentrated loss, a specific upstream delivery breakdown, and a targeted operational response.
The discrepancy between frequency and damage magnifies significantly during promotional periods. A promoted item typically operates within a short selling window and features intense demand concentration, turning an empty shelf into an extraordinarily costly event. If a retailer continues running a marketing campaign while the promoted product is out of stock, they are effectively paying to create consumer demand that they cannot possibly fulfill. This dynamic is precisely why relying on a stockout rate as a standalone store ranking fails to capture operational reality. It functions adequately as a high-level operating measure, but it completely fails to serve as an accurate severity score.
Weight the problem by demand, margin, and customer behavior
A more sophisticated approach requires retail management teams to evaluate how much demand was anticipated during each stockout window and what economic value was attached to that specific demand. Furthermore, teams must account for whether the frustrated shopper is likely to substitute the item or simply walk away from the purchase entirely. These critical questions provide the foundation for setting genuine operational priorities.
The simplest improvement to traditional reporting is demand weighting. Instead of treating every unavailable product-hour as equal, analytics teams can estimate expected sales during the precise hours an item was out of stock. The same principle applies to product margins. A lost sale involving a high-margin item warrants significantly more managerial attention and faster replenishment than a lost sale of a low-margin accessory.
Consumer behavior introduces a layer of complexity that makes the data less neat, but vastly more reflective of reality. According to Salsify’s Q4 2025 Ecommerce Pulse Report, 58% of shoppers chose to buy a different product from an entirely different brand when their preferred brand was unavailable. Furthermore, 33% of respondents stated they simply purchased the product from another domestic retailer instead. Consequently, a stockout leaks commercial value not just through the missing item itself, but through the potential loss of the entire shopping basket. Over time, future customer loyalty remains at serious risk.
Modern retail dashboards must clearly distinguish between stockout occurrence and stockout exposure. Occurrence answers the basic question of how many times products were unavailable. Exposure, by contrast, measures the commercial risk sitting directly behind those operational failures.
In modern omnichannel retail environments, where physical stores and digital channels frequently share inventory pools, stock availability becomes increasingly difficult to interpret. The exact same inventory can serve multiple customer journeys simultaneously. A unit might be recorded as physically on hand in a system, but it could be actively reserved for a curbside pickup order or still sitting in the backroom undergoing receiving processes. Inventory misplaced directly on the sales floor also renders those units unavailable for online fulfillment, while stale inventory records further widen the gap between system data and reality.
The same stock-keeping unit (SKU) can appear fully available in one inventory view while remaining entirely out of reach when a customer attempts to complete a purchase. Consequently, retail technology must possess the capability to distinguish recorded inventory from inventory that is genuinely capable of fulfilling an active order.
Research published in the Journal of Retailing in 2025 highlights yet another reason why fulfillment failures should never be dismissed as isolated incidents. In the omnichannel grocery operations studied, an order that failed to be fulfilled as originally expected delayed the customer’s subsequent order by an average of 7.22%, while overall spending simultaneously declined. These spending reductions and delays were especially pronounced when the failed items involved promoted goods. This evidence proves that stockouts disrupt much more than a single transaction; they alter immediate order values, force substitution decisions, and delay long-term purchasing cycles.
Use three layers: occurrence, exposure, and action
Building a more effective retail dashboard does not require building an overly complicated inventory model. Instead, it requires separating operational questions into distinct analytical layers.
The first layer focuses strictly on occurrence. Retailers should maintain familiar supply chain performance measures, such as basic stockout rates and product availability percentages, while tracking how many SKUs were affected and how long each shortage lasted. These baseline measures provide operations teams with a clear picture of how frequently problems are occurring.
The second layer addresses exposure. By starting with projected demand for the out-of-stock period, calculating estimated lost sales, and factoring in product margins, analysts can properly evaluate risk. Promoted items should be flagged separately to highlight why a specific SKU or category carries disproportionate importance. Because lost-sales exposure serves as an estimate to guide decision-making rather than a booked accounting loss, underlying assumptions must remain transparent and clear.
Action constitutes the third and final layer. Before deciding which vendor or replenishment process requires intervention, management must identify the exact store and SKU involved. Did fast-selling trends drive the problem? Did the stockout occur immediately following a marketing promotion? Is a specific store repeatedly running out of the same core products while surplus inventory sits elsewhere in the regional network? These are the practical questions that real-time supply chain analytics must answer.
Ultimately, an effective retail dashboard combines store-level stockout rates with estimated lost-sales exposure and at-risk inventory. One key performance indicator reveals how frequently stockouts happen, while the surrounding measurements determine what leadership should actually do about them.
Stop rewarding a good average
During weekly retail performance reviews, a short, focused list of operational exceptions proves far more valuable than yet another sweeping league table. Retail dashboards are frequently crowded with healthy-looking averages that conceal severe underlying issues until someone asks where the commercial damage is truly concentrated. The portfolio stockout rate is a primary example of this phenomenon.
A handful of high-value stores, critical products, or peak trading periods can absorb the vast majority of commercial pain, allowing an entire retail portfolio to sit comfortably within a corporate availability target. The mathematical average itself is not incorrect; it is simply too polite to be useful.
To drive real operational change, management must ask targeted questions: Which high-demand SKUs were missing from shelves? Which stockouts coincided directly with active promotions? Where are estimated lost sales accelerating? Which store locations are continually missing the same core merchandise?
Answering these questions transforms product availability from a passive reporting metric into an active operational decision. During upcoming store-management reviews, leadership can assign a clear owner and a strict deadline to the highest-exposure stockout in the network. By keeping the exception open until the team verifies whether the corrective action successfully restored availability during the critical selling window, retailers can ensure that while frequency matters, commercial severity dictates where the organization acts first.








No comments yet. Be the first to join the conversation!