

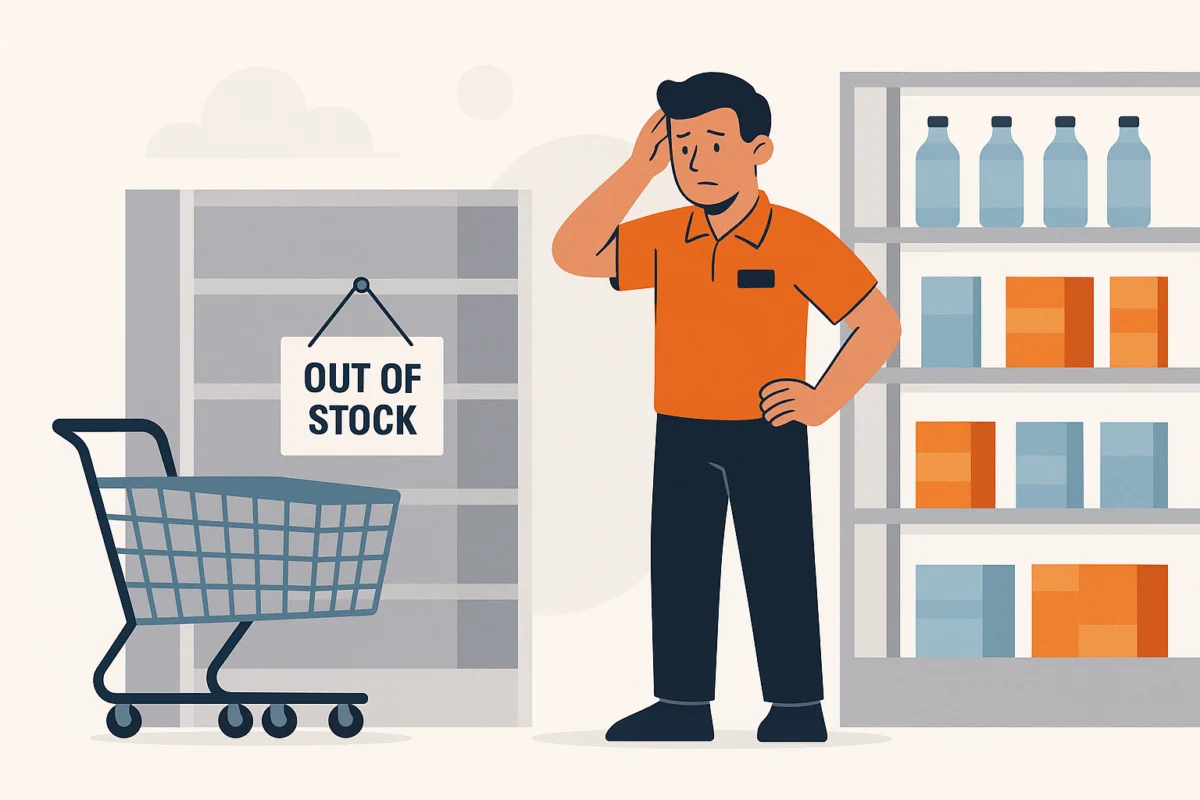
According to industry analysts, tracking mere stockout frequency rather than financial exposure creates a dangerous blind spot in modern retail analytics. A stockout involving a low-volume fashion accessory on a quiet Tuesday morning carries a vastly different commercial impact than an empty shelf for a heavily promoted bestseller on a peak Saturday afternoon. Yet, basic stockout percentages count both events identically, transforming a potentially useful key performance indicator into a deeply misleading metric.
Shoppers themselves place product availability at the very top of their priorities. A comprehensive 2025 shopper survey conducted by the SPAR Group revealed that 74 percent of respondents considered product availability their primary in-store concern, while 73 percent identified out-of-stock items as a leading barrier to a positive shopping experience. Retailers are acutely aware that stockouts matter, but the pressing question facing management teams is whether their measurement tools actually highlight the shortages that require immediate intervention.
A stockout count measures frequency, not damage
Traditional stockout metrics are designed to report how often a particular item was unavailable to consumers, but they fail to capture the volume of unmet demand sitting behind that empty space on the shelf. This structural flaw in measurement becomes glaringly obvious when analyzing real-world retail disruptions.
During the Christmas 2024 shopping season, beauty retailer KICKS traced 39 percent of its total lost sales to a single supplier, a vulnerability that came to light through detailed operational accounts provided by RELEX Solutions. By overhauling supplier processes and implementing a strict 24-hour delivery completion requirement, KICKS managed to achieve a 34 percent reduction in lost-sales value tied directly to late deliveries. This response demonstrated the value of a precise diagnosis: a concentrated financial loss, a specific logistical failure, and a targeted operational remedy.
The danger multiplies exponentially during promotional campaigns. Promoted items typically operate within a tightly compressed selling window characterized by heavily concentrated demand, rendering an empty shelf exceptionally costly. When a promotion continues running while the underlying product is entirely out of stock, the retailer essentially pays to manufacture consumer demand that it cannot possibly fulfill.
Consequently, relying on a generic stockout rate as a primary store ranking metric fails to provide a true severity score. While it remains a useful high-level operating measure, it offers little insight into the actual financial damage being inflicted on the business.
Weight the problem by demand, margin and customer behavior
A more sophisticated approach requires retail management to evaluate how much demand was projected during each stockout window, alongside the economic value attached to that specific demand. Furthermore, teams must analyze whether disappointed shoppers are likely to accept a substitute product or simply walk away from the retailer entirely.
The most straightforward enhancement to traditional metrics is demand weighting. By estimating expected sales during the precise hours an item was out of stock rather than treating every unavailable product-hour as equal, retailers gain a clearer picture of reality. The same logic applies directly to profit margins. Losing a sale on a high-margin product naturally warrants far more operational urgency than missing a sale on a low-margin item.
Consumer behavior introduces additional complexity, turning theoretical inventory models into real-world challenges. Data from Salsify’s Q4 2025 Ecommerce Pulse Report indicates that 58 percent of shoppers confronted with an out-of-stock item will purchase an alternative product from a completely different brand. Meanwhile, 33 percent will take their business to an entirely different domestic retailer. A stockout therefore leaks value far beyond the immediate missing item, threatening the broader basket and eroding future customer loyalty.
Modern retail dashboards must clearly distinguish between stockout occurrence and stockout exposure. Occurrence simply answers how many times inventory was unavailable, whereas exposure measures the commercial risk hiding behind those events.
In omnichannel retail environments, where physical stores and digital channels draw from shared inventory pools, stock availability becomes even harder to interpret accurately. The exact same inventory might serve multiple customer journeys simultaneously. A unit could be recorded as physically on hand in the system, yet remain reserved for an in-store pickup order or sit unprocessed in a backroom receiving area. Items misplaced on the crowded sales floor are similarly unavailable for online fulfillment, while stale inventory records compound these discrepancies.
As a result, the exact same stock-keeping unit may look fully available in one system view while remaining completely inaccessible when a customer attempts to buy it. Retail technology must be sophisticated enough to differentiate between recorded inventory and inventory capable of actually fulfilling an active order.
Research published in the Journal of Retailing highlights that fulfillment failures ripple far beyond a single isolated transaction. In an omnichannel grocery operation studied by researchers, an order that failed to be fulfilled as originally promised delayed the customer’s subsequent order by an average of 7.22 percent, while overall customer spending also declined. These negative impacts were particularly pronounced when promoted items failed to ship.
These findings demonstrate that a stockout is rarely a localized event. It actively alters the current purchase, influences immediate substitution behavior, and shifts the timing of the customer’s next visit.
Use three layers: occurrence, exposure and action
To address these complexities, retail dashboards should separate stockout frequency from commercial exposure before defining the necessary operational response. Implementing this structure does not require an overwhelmingly complex inventory model, but rather a disciplined separation of analytical questions.
The foundational layer focuses on occurrence. Retailers can maintain familiar supply chain performance measures, such as overall stockout rates and product availability percentages, while recording how many SKUs were affected and how long each shortage lasted. These metrics inform operations teams about the sheer frequency of inventory issues.
The second layer measures exposure. By evaluating projected demand for the out-of-stock period, calculating estimated lost sales, and factoring in product margins, management can flag promotions separately and understand the true commercial significance of a missing SKU. Because lost-sales exposure serves as an analytical estimate for decision-making rather than a booked accounting loss, the underlying assumptions must remain transparent.
The final layer centers on action. Teams must identify the exact store and SKU before determining whether a specific vendor or replenishment process requires intervention. Questions regarding whether fast-selling items are driving chronic shortages, whether stockouts consistently follow promotional pushes, and whether inventory sits unused elsewhere in the network become vital for real-time supply chain analytics.
Ultimately, a truly useful retail dashboard combines store-level stockout rates with estimated lost-sales exposure and at-risk inventory. While frequency metrics indicate how often shortages happen, surrounding commercial measures determine how the organization should respond.
Stop rewarding a good average
Relying on broad corporate averages during weekly retail reviews often creates a false sense of security. Retail dashboards are frequently dominated by polished availability averages that look impressive until someone investigates where the financial damage is concentrated.
A select few high-value stores, high-demand products, or critical trading periods can absorb the vast majority of commercial pain, allowing an entire retail portfolio to sit comfortably within internal availability targets. The corporate average is rarely mathematically incorrect; it is simply too polite to reveal underlying operational stress points.
Transitioning availability from a passive reporting metric into an active operational decision requires asking tougher questions during management reviews. Teams must examine which high-demand SKUs experienced shortages, which stockouts coincided with active promotions, where estimated lost sales are accelerating, and which stores repeatedly miss the same core products.
By assigning a clear owner and a definitive deadline to the highest-exposure stockout during store-management reviews, retailers can shift their focus away from harmless averages. Management must keep these operational exceptions open until teams verify whether corrective actions successfully restored product availability during the most critical selling windows. Frequency certainly matters, but commercial severity must dictate where retail organizations direct their attention first.










No comments yet. Be the first to join the conversation!